
The cosmic microwave background is the oldest light in the universe - a near-uniform 2.7255 K glow from when the cosmos was about 380,000 years old. This all-sky map shows its 3.36 mK dipole and tiny ~18 microkelvin anisotropies (exaggerated to be visible).
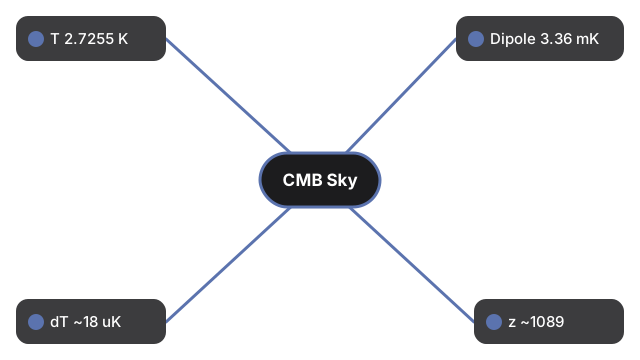
Published literacy: CMB mean temperature 2.7255 K; dipole 3.3621 mK; small-scale anisotropy about 18 microkelvin (dT/T about 1 in 100,000); last scattering at redshift z ~ 1089, roughly 380,000 years after the Big Bang.
Drag to orbit and scroll or pinch to zoom. Toggle the dipole, toggle the small-scale anisotropies, or pause the spin.
Cosmic Microwave Background 3D Explorer
freetoolonline.com editorial team
This browser explorer draws the cosmic microwave background (CMB) as an all-sky temperature map on the last-scattering sphere - the oldest light we can see, released when the universe was about 380,000 years old at a redshift of about z = 1089. Blue is slightly cooler and red slightly warmer than the mean.
The CMB is astonishingly uniform: its mean temperature is 2.7255 K (the monopole). On top of that sits a 3.3621 mK dipole - one side of the sky looks warmer because the Solar System is moving relative to the CMB rest frame (a Doppler effect). Removing the dipole reveals the real prize: small-scale anisotropies of only about 18 microkelvin, a temperature contrast of roughly one part in 100,000, which seeded the galaxies and cosmic structure we see today.
- All-sky temperature map coloured blue (cool) to red (warm), Planck-style
- Toggle the 3.36 mK dipole from our motion through the CMB
- Toggle the small-scale anisotropies (exaggerated so the ~18 microkelvin pattern is visible)
- Pausable spin so you can inspect the whole sphere
- Facts panel lists the monopole, dipole, anisotropy, and last-scattering figures
- Runs fully in the browser with the vendored three.js engine - no account, no upload
Students see why the CMB is called a near-perfect blackbody with a tiny ripple; teachers separate the monopole, dipole, and anisotropy components; curious readers connect a 2.7 K glow to the seeds of cosmic structure.
| Figure | Value | Source note |
|---|---|---|
| Mean temperature (monopole) | 2.7255 K | PDG CMB review; Fixsen 2009 gives 2.72548 K |
| Dipole amplitude | 3.3621 mK | Doppler boost from Solar System motion |
| Small-scale anisotropy | about 18 microkelvin | dT/T about 1e-5 after dipole removal |
| Last scattering | z ~ 1089 | About 380,000 years after the Big Bang |
| Universe age | 13.797 billion years | Planck |
Everything renders on your device with WebGL. The 3D engine loads once (about 0.7 MB) and is cached; no scene data is sent to a server.
This is an educational visualization - the colour map is illustrative and the anisotropies are exaggerated for visibility; it is not the actual Planck sky map data.
For a step-by-step walkthrough, read the Cosmic Microwave Background 3D Explorer step-by-step guide. The Space 3D collection also includes Expanding Universe 3D and Black Body Radiation 3D.
Frequently Asked Questions
What is the cosmic microwave background?
It is the oldest light in the universe - radiation released about 380,000 years after the Big Bang, when atoms first formed and the cosmos became transparent. Today it fills the sky as a near-uniform 2.7255 K glow.
Why is one side of the sky warmer (the dipole)?
The 3.3621 mK dipole is a Doppler effect: the Solar System moves relative to the CMB rest frame, so the direction we move toward looks slightly warmer and the opposite direction slightly cooler.
How big are the real anisotropies?
After removing the dipole, the small-scale temperature variations are only about 18 microkelvin - roughly one part in 100,000 of the 2.7255 K mean. This scene exaggerates them so you can see them.
Why do the tiny fluctuations matter?
They are the seeds of cosmic structure. Slightly denser regions in the early universe grew under gravity into the galaxies and the cosmic web we see today.
What is redshift z ~ 1089?
It marks the moment of last scattering - the CMB light has been stretched by the expansion of the universe by a factor of about 1090 since it was emitted, cooling from thousands of kelvin to 2.7 K.
Is this the real Planck map?
No. The colours are an illustrative temperature map and the anisotropies are exaggerated for visibility. It is a learning visualization, not the actual Planck satellite sky data.