
Explore a schematic Hertzsprung-Russell diagram: temperature hot-left / cool-right, luminosity log(L/Lsun) upward. Main sequence band, giants, white dwarfs, and the Sun at Teff ~5,772 K and L = 1 Lsun.
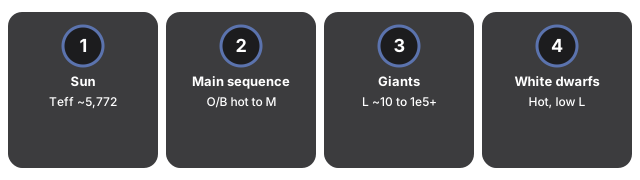
Sun: Teff ~5,772 K, L = 1 Lsun. Main sequence spans hot O/B stars to cool M dwarfs. Giants and supergiants reach high luminosity (~10 to 1e5+ Lsun). White dwarfs are hot but faint.
Drag to orbit and scroll or pinch to zoom. Use Main sequence / Giants / White dwarfs / Sun to highlight loci, or scrub Spectral class along the MS band.
HR Diagram 3D Explorer
The Hertzsprung-Russell (HR) diagram plots temperature (hot left, cool right) against log(L/Lsun). This browser explorer shows schematic loci - not a full stellar catalog.
The Sun sits at Teff ~5,772 K and L = 1 Lsun on the main sequence. The colored band runs from hot O/B stars to cool M dwarfs. Giants and supergiants occupy the high-luminosity region (~10 to 1e5+ Lsun). White dwarfs are hot but faint in the lower-left region.
Press Main sequence, Giants, White dwarfs, or Sun to highlight each locus. Scrub Spectral class (O through M) along the MS band, or open Facts table for the teaching summary.
- Axes: temperature (K) horizontal; log(L/Lsun) vertical
- Main-sequence point cloud colored blue-white-yellow-orange-red by temperature
- Separate regions for giants (high L) and white dwarfs (hot + faint)
- Bright Sun marker at Teff ~5,772 K, L = 1 Lsun
- Highlight buttons and optional spectral-class scrubber
- Facts panel with luminosity, temperature, and approximation honesty
- Runs fully in the browser with the vendored three.js engine - no account, no upload
Students compare MS, giant, and white-dwarf regions; teachers demo HR loci without a spreadsheet; curious readers see how temperature and luminosity classify stars schematically.
| Locus | Figure | Source note |
|---|---|---|
| Sun | Teff ~5,772 K, L = 1 Lsun | G-type main-sequence anchor |
| Main sequence | O/B hot to M cool | Hydrogen-burning band |
| Giants | L ~10 to 1e5+ Lsun | Evolved high-luminosity locus |
| White dwarfs | Hot, low L | Remnant region |
Everything renders on your device with WebGL. The 3D engine loads once (about 0.7 MB) and is cached; no scene data is sent to a server.
This is an educational schematic diagram of HR loci - not a full stellar catalog visualization. It does not place Hipparcos or Gaia stars, does not fit isochrones, and does not draw binary evolutionary tracks.
For a step-by-step walkthrough, read the HR Diagram 3D Explorer step-by-step guide. When you only need session fit and limits, see when to use HR Diagram 3D Explorer. The Space 3D collection also includes Star Lifecycle 3D and Black Body Radiation 3D.
Frequently Asked Questions
What does the HR Diagram 3D Explorer show?
A schematic Hertzsprung-Russell diagram: main sequence band, giants, white dwarfs, and the Sun at Teff ~5,772 K and L = 1 Lsun with temperature and log(L/Lsun) axes.
Where is the Sun on the diagram?
At Teff ~5,772 K and L = 1 Lsun on the main sequence - the G-type anchor marked with a bright sphere in the scene.
What are the axes?
Horizontal: temperature in kelvin (hot left, cool right). Vertical: log(L/Lsun). This matches the usual HR teaching orientation.
Is this a stellar catalog?
No. It is an educational schematic diagram of HR loci - not a full stellar catalog visualization or observational database.
How do I explore each locus?
Press Main sequence, Giants, White dwarfs, or Sun to highlight regions. Scrub Spectral class along O through M, or Facts table for the summary.
How do giants and white dwarfs differ here?
Giants sit at high luminosity (~10 to 1e5+ Lsun). White dwarfs are hot but faint - high temperature with low L in the lower-left region.