Live Wildfire Map vs the Alternatives - Honest Comparison
The live wildfire map, official agency incident pages, full GIS fire dashboards, and mobile alert apps mostly read the same federal incident data. They differ in what you trade for depth: install time, page weight, notifications, and privacy. The table below is the short answer.
The comparison
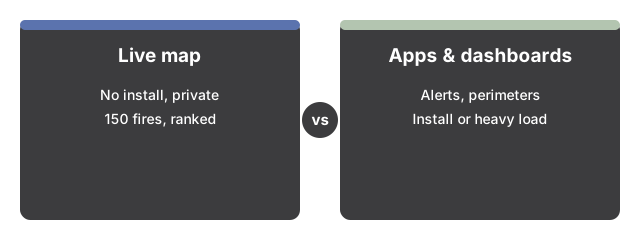
| What you care about | This page | Agency incident pages | GIS fire dashboards | Mobile alert apps |
|---|---|---|---|---|
| Setup before first view | 0 installs, 0 accounts | 0 installs | 0 installs, heavy first load | App install + permissions |
| Filters to narrow fires | 3 (state, size, type) + distance sort | Search + per-incident pages | Many (layers, drawing tools) | Location-based feed |
| Fires listed at once | Up to 150 largest, ranked | 1 per page | All, on map tiles | Nearby subset |
| Perimeter polygons | No - point locations only | Per-incident maps | Yes | Some |
| Push notifications | No | No | No | Yes |
| Data sent about you | Nothing; optional one-shot location stays in the tab | Standard web analytics | Varies by host | Continuous location, typically |
When this page wins
You want the national or state picture in seconds: how many fires, which are big, how contained, and how far from you - with nothing installed and nothing tracked. The dot map plus the largest-first list answers that faster than loading a tile-based dashboard, and the built-in NWCG size-class explainer decodes the jargon on the spot.
When an alternative wins
Evacuation and life-safety alerts: a mobile alert app or official local channels - this page has no notifications and the federal feed lags agency reporting by hours. Perimeter shapes and satellite hotspot layers: an agency GIS dashboard; this page deliberately plots point locations on a coordinate grid with no basemap tiles. Deep detail on one fire (closures, evacuation zones, daily updates): that fire's official incident page.
Same data, different packaging
All of these ultimately trace back to US interagency reporting (NIFC WFIGS and the agencies that file into it), so acreage and containment numbers should broadly agree everywhere. What you are really choosing is packaging: speed and privacy here, layers and depth in a dashboard, alerts in an app. To see how this page works in practice, start with the step-by-step walkthrough or check when it is the right choice.
Why trust these tools
- Ten-plus years of web tooling. The freetoolonline editorial team has shipped browser-based utilities since 2015. The goal has never changed: get you to a working output fast, without an install.
- No install, no sign-up. Open a tool and get a working output in seconds - nothing to download and no account to create. Tools that need heavy processing run it on our service, so even a low-powered machine gets the job done.
- Analytics stops at the page view. We measure which pages get visited, not what you type or upload inside a tool. There is nothing to sign in to and no profile is attached to your input.
- Open-source core components. The processing engines underneath (libheif, libde265, pdf-lib, terser, clean-css, ffmpeg.wasm, and others) are public and audit-able. We link to each one in its tool page's footer.
- Free, with or without ads. All tools are fully functional without sign-up. The Disable Ads button in the header is always available if you need a distraction-free run.